Reading Forex Charts Using Multi-Timeframe Analysis

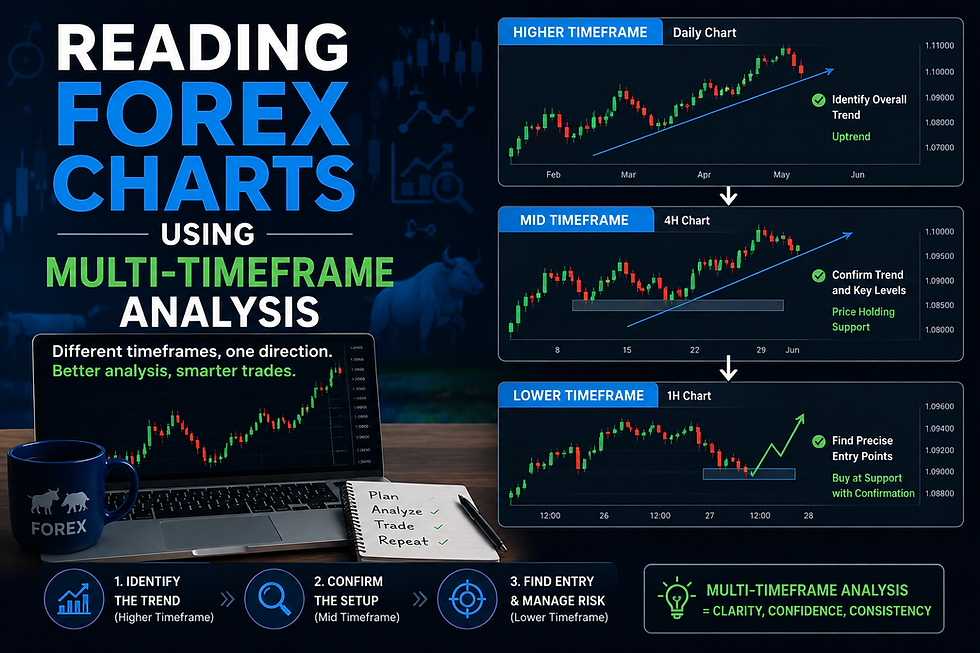
Look at the same currency pair on a 5-minute chart and a daily chart, and you could be forgiven for thinking they're two different markets entirely. This is exactly why multi-timeframe analysis has become such a widely used approach among forex traders. For anyone still learning how to read forex charts, this approach can feel like an important next step. It shifts the focus from isolated price movements to a more structured view of market trends, support and resistance, and overall market structure.
Let’s figure out how to read a forex chart using multi-timeframe analysis in the guide below.
What is Multi-Timeframe Analysis?
Multi-timeframe analysis is the practice of examining the same currency pair across two or more timeframes. Typically, it includes a higher timeframe for context and a lower timeframe for precision.
The idea behind the analysis is simple. It includes bigger-picture trends that provide direction, while the smaller timeframes can help precisely with the entry and exit points. The reason why traders use this method is that a single chart rarely tells the whole story. A pair might look bullish on an hourly chart while remaining in a broader downtrend on the daily chart. Without checking both, a trader could easily misread the situation.
What is the Role of Higher, Intermediate, and Lower Timeframes?
Each timeframe in the multi-timeframe analysis serves a distinct purpose. Thus, understanding their roles can help traders build a structured, repeatable process rather than jumping between charts at random. This is what they mean:
· Higher Timeframe: Establishing the TrendThe higher timeframe, often the Daily or Weekly chart, is generally used to identify the dominant market trend. This broader view of market structure helps traders understand whether the overall bias is bullish, bearish, or ranging.
· Intermediate Timeframe: Mapping Key LevelsAn intermediate timeframe like the 4-hour chart is commonly used to identify support and resistance levels within the broader trend. This is often where traders look for trend confirmation before narrowing their focus further.
· Lower Timeframe: Refining Entries and ExitsThe lower timeframe, e.g., the 1-hour or 15-minute chart, can help traders to fine-tune their entry and exit points. This is typically the timeframe where candlestick patterns and short-term price action are used.
Here's how Multi-Timeframe Analysis might look in practice:
Timeframe | Purpose | Example Use |
Daily chart | Identify the broader trend | Confirming the pair is in an uptrend |
4-hour chart | Locate key levels | Marking recent support and resistance zones |
1-hour chart | Refine entry | Watching for a candlestick pattern near support |
How to Align Trend Direction Across Timeframes?
One of the main goals of multi-timeframe analysis is trend alignment. When the trend direction agrees across higher and lower timeframes, trade setups may carry more weight than those based on a single, isolated signal.
A simple approach many traders follow is:
· Check the higher timeframe first to determine the broader trend.
· Move to the intermediate timeframe to identify relevant support and resistance levels.
· Use the lower timeframe to look for entry signals, such as candlestick patterns, that align with the higher timeframe trend.
This top-down process can help reduce the likelihood of trading against the broader market trend.
This is also where specific price action signals become more meaningful. A pin bar candlestick forming on the lower timeframe, for example, tends to carry more weight when it appears near a key level and aligns with the trend already confirmed on the higher timeframe.
Advantages of Using Multiple Timeframes
Traders who incorporate multi-timeframe analysis into their routine often cite several practical advantages. Some of the major ones are:
· Better trend confirmation: aligning direction across timeframes can reduce the chance of trading against the broader trend.
· Improved timing: lower timeframes can help refine entries, potentially improving the risk-to-reward profile of a trade.
· Reduced false signals: a signal that appears on one timeframe but conflicts with the higher timeframe trend may be treated with more caution.
Common Mistakes to Avoid
Even experienced traders can fall into a few recurring traps when using multi-timeframe analysis:
· Relying on a single timeframe. This can create a narrow, incomplete view of market conditions.
· Analysing too many timeframes at once. This often leads to conflicting signals and decision paralysis rather than clarity.
· Ignoring the broader market context. Entering trades based purely on a lower-timeframe signal, without checking the higher-timeframe trend, can increase exposure to false breakouts.
Practical Tips for Building a Multi-Timeframe Routine
Here is how you can build a multi-timeframe routine:
· Start with three timeframes maximum: one higher, one intermediate, one lower.
· Always check the higher timeframe trend before analysing lower timeframes.
· Use consistent timeframe combinations across your trading strategy, rather than switching frequently.
· Keep a record of how trades align across timeframes to review what works over time.
· Combine multi-timeframe analysis with sound risk management practices, rather than treating it as a standalone system.
Conclusion
Finally, to conclude, the multi-timeframe analysis offers forex traders a more structured way to read price action, combining the broader context of higher timeframes with the precision of lower ones. Rather than relying on a single chart in isolation, this approach helps traders identify market trends, key levels, and potential entry points with greater clarity.
Like any technical analysis method, multi-timeframe analysis doesn't remove risk or guarantee results, but it can help traders build a more disciplined and consistent approach to reading forex charts.


Comments